
Bridging the Insight Gap: Why Modern Enterprises Must Master Data Storytelling to Unlock the Value of Social Intelligence


In the contemporary digital ecosystem, corporate social media accounts routinely generate massive waves of digital activity. Engagement metrics surge, brand mentions spike, and sentiment trends decisively positive. Consumers frequently share organic "life hacks" regarding newly launched merchandise or services, creating a picture of thriving brand health. However, a critical disconnect persists across corporate structures: if organizations fail to translate these metrics into actionable enterprise intelligence, favorable momentum remains localized within marketing dashboards, resulting in zero structural evolution elsewhere in the company.
This phenomenon traps modern social media teams in a perpetual cycle of underappreciated value. The data flowing into these departments represents perhaps the freshest, most unfiltered view of market sentiment available, functioning essentially as the world’s largest, unprompted focus group. Yet, according to comprehensive industry data from the 2026 Social Intelligence Report, a mere 36 percent of organizations possess the cross-functional capability to channel these vital insights into decision-making processes outside traditional marketing boundaries. When vital market signals fail to travel beyond the social media desk, a technical data challenge swiftly morphs into an organizational storytelling crisis. Constructing a compelling, narrative-driven framework around raw metrics—and illuminating precisely why those numbers matter to diverse stakeholders—is no longer an optional luxury; it is a fundamental business imperative.
The Anatomy of Modern Data Storytelling
Data storytelling is the sophisticated practice of merging quantitative data science, narrative arcs, and precise visualization to breathe life into static dashboard metrics. Its primary objective is to decode complex spreadsheets, highlight underlying realities, and compel decision-makers to take definitive action.
Within the enterprise hierarchy, social media analytics serve as a premier catalyst for this discipline because they deliver unvarnished market intelligence. Traditional data streams—such as Customer Relationship Management (CRM) records, customer support ticketing systems, and quarterly pipeline reports—exclusively reflect the behaviors of individuals who have already established a formalized relationship with the enterprise. Conversely, social media captures spontaneous, real-time reactions from a vastly broader audience, often registering consumer sentiment, emerging product flaws, or unexpected use cases long before they register in formal customer service channels.

When a sudden spike of consumer commentary questions a recent pricing modification, or a viral wave of enthusiasm greets a feature slated for retirement, that information constitutes a critical enterprise narrative. Leaving such powerful signals trapped inside a marketing silo represents a severe missed opportunity for product development, executive leadership, and supply chain management alike.
The Historical Evolution of Enterprise Data Utilization
For decades, corporate decision-making was dominated by lagging indicators. Executive boards relied heavily on historical financial reports, quarterly sales figures, and formalized annual market research studies to chart corporate strategy. While these backward-looking metrics provided financial stability, they chronically failed to capture the fluid, highly volatile shifts of modern consumer sentiment.
The emergence of social listening tools in the early 2010s revolutionized how organizations gathered feedback, moving them from reactive surveys to proactive monitoring. However, this technological leap created an unintended byproduct: data overload. Social media managers suddenly found themselves drowning in petabytes of unstructured text, sentiment scores, and engagement rates.
By the mid-2020s, industry analysts began identifying a governance failure rather than a technological one. Research indicated that an overwhelming 86 percent of organizations missed tangible business opportunities over a two-year window simply because insights derived from social channels were delayed, poorly integrated, or completely lacking a coherent narrative structure. Executives were not rejecting social data out of hand; rather, social teams were presenting raw numerical outputs rather than contextualized stories that connected directly to revenue generation, operational efficiency, and risk mitigation.
Breaking Down the Silos: Cross-Functional Translation
Operating at the intersection of brand perception and consumer reality, social media teams frequently function as cross-functional bridges. Yet, different departments speak vastly different organizational languages. While the social team may understand the nuances of an organic consumer trend, executives, product engineers, and financial officers require that exact same data translated into metrics that align with their specific Key Performance Indicators (KPIs).

Executive leadership naturally gravitates toward quantitative data because it provides a direct, unclouded mapping to the enterprise bottom line. To capture the attention of a Chief Executive Officer or Chief Financial Officer, social strategists must demonstrate clear correlations: how audience growth directly influences sales pipelines, or how expedited customer service response times correlate with long-term client retention rates.
Simultaneously, quantitative data alone can feel sterile to product and design teams. Incorporating qualitative elements—such as verbatim consumer comments, annotated screenshots, and unprompted video testimonials—adds necessary color and emotional resonance. This dual-pronged approach transforms dry analytics into a persuasive narrative that validates the numbers with authentic human voices.
Core Pillars of an Effective Data Narrative
Constructing a high-impact data story requires meticulous audience segmentation. Just as marketers tailor content for distinct consumer demographics, internal data storytellers must package insights based on the specific department receiving the information.
1. Contextualizing Quantitative Metrics
Raw numbers stripped of their industry context inevitably generate skepticism rather than consensus. Effective data storytellers contextualize internal shifts against broader macroeconomic conditions and competitor performance. By pairing quantitative indicators—which outline what occurred—with qualitative insights that explain why the shift happened, analysts transform a simple metric into a strategic roadmap.
2. Intentional Data Visualization
Every visual aid integrated into a presentation or report must actively streamline comprehension rather than merely occupy empty slide space. Visualizations should highlight trends, anomalies, or correlations instantly, allowing stakeholders to grasp complex operational realities within seconds.

3. Implementing a Classic Narrative Arc
Memorable data presentations mirror timeless storytelling structures. They establish the baseline setting, introduce an unexpected obstacle or market shift, highlight the crucial turning point within the data, and conclude with a definitive resolution. When a social intelligence report follows this trajectory, stakeholders retain the core message long after leaving the boardroom, enabling them to accurately repeat and champion the insight in subsequent departmental meetings.
A Step-by-Step Framework for Executing Data Storytelling
To ensure that analytical findings systematically drive enterprise value, social and marketing professionals should adopt a structured, six-step framework before presenting insights to leadership:
- Isolate High-Impact Data Points: Begin by defining the primary objective of the presentation—whether it involves justifying a budgetary expansion or evaluating a recent marketing campaign. Select the quantitative and qualitative data points that most powerfully support this objective, paying special attention to metrics that contradict initial institutional assumptions.
- Command Attention Early: Eschew chronological monotony by leading with the second most compelling data point. This establishes immediate authority and curiosity without prematurely revealing the core conclusion.
- Integrate Visuals Dynamically: Layer visual aids progressively as the narrative unfolds. Rather than displaying a static, overcrowded chart, introduce graphs and data overlays sequentially to match the progression of the spoken narrative.
- Anticipate Counterarguments: Sophisticated stakeholders will naturally interrogate correlations. Prepare for inquiries regarding causation versus correlation by embedding supplementary data slides that directly address anticipated skeptical challenges.
- Deliver the Grand Finale: Conclude the analytical presentation with the single most striking, definitive piece of evidence. This leaves the audience with a powerful, memorable takeaway backed by both robust numbers and human context.
- Answer the "So What?": Every data story must culminate in a clear, actionable implication. Clearly articulate how the presented insights directly influence future strategic initiatives, product roadmaps, or operational adjustments.
Industry Benchmarks and Exemplary Models
Organizations across diverse sectors have begun pioneering innovative approaches to data visualization and narrative construction, offering valuable blueprints for enterprise adoption.
In the technology sector, projects like Jetpack AI’s interactive baby name visualizations demonstrate that compelling data storytelling need not be overly complex. By incorporating gamification elements—allowing users to input custom search terms and observe immediate, dynamic shifts in historical popularity—the platform encourages active participation and deep cognitive engagement.
Similarly, independent data journalism organizations such as The Pudding have consistently established gold standards for visual storytelling. By transforming granular linguistic studies and cultural trends into deeply immersive, interactive web experiences, they prove that complex datasets can be rendered universally accessible and thoroughly captivating.
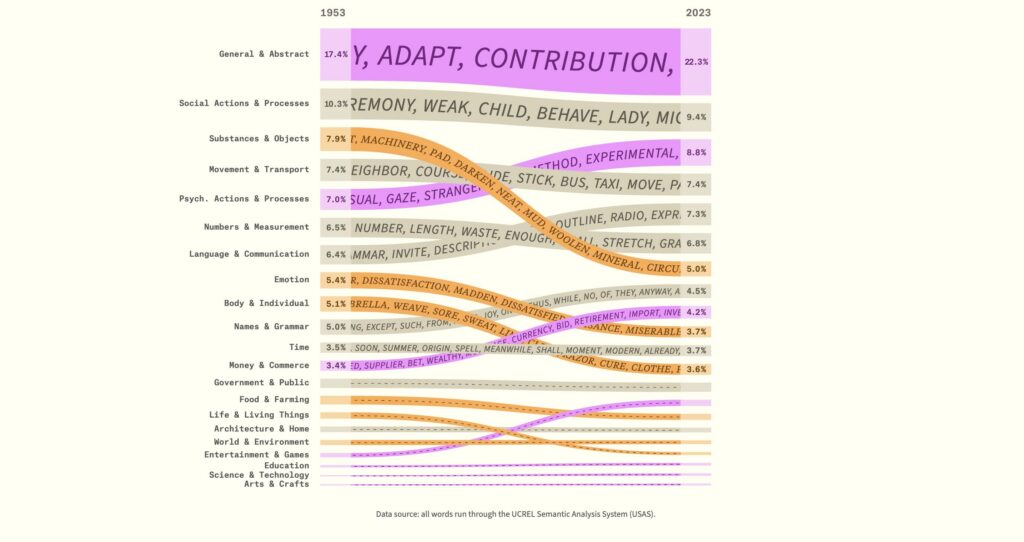
Within enterprise software, organizations like Sprout Social regularly integrate digestible research reports with streamlined visual aids, proving that data storytelling thrives when quantitative industry benchmarks are paired with immediate, actionable recommendations for the reader.
The Future of Enterprise Intelligence
Ultimately, the true mark of a successful data story is its ability to travel beyond the immediate presentation room. When a social insight is properly structured, contextualized, and narrated, it gets repeated in executive sessions where the marketing team is absent, quoted by engineering leads to justify a critical software update, or referenced by product developers as the primary catalyst for a new roadmap priority.
Achieving this level of organizational influence requires transcending traditional spreadsheet reporting. By deeply understanding cross-functional audiences, marrying rigorous quantitative metrics with rich qualitative context, and consistently concluding presentations with clear, actionable steps, modern enterprises can successfully dissolve internal silos. Harnessing the unfiltered voice of the market is no longer merely a social media objective—it is the cornerstone of agile, data-driven enterprise leadership.
Related posts: