The Truth Behind the Colors: How NASA Translates the Infrared Universe into Iconic Images

The teal peaks and orange haze of the Cosmic Cliffs, the Carina Nebula image that served as a cornerstone of the James Webb Space Telescope’s inaugural data release in July 2022, represent one of the most significant triumphs in the history of scientific visualization. To the human eye, these colors do not exist in the way they appear on a screen. Because the James Webb Space Telescope (JWST) operates almost entirely within the infrared spectrum—wavelengths invisible to human biological sensors—the vibrant hues seen in public releases are the result of a sophisticated, evidence-based translation process. Far from being "fake," these images are precise cartographies of data that render the invisible universe legible.
The Physics of the Invisible Spectrum
To understand the nature of these images, one must first understand the architecture of the telescope itself. The JWST is equipped with two primary imaging suites: the Near-Infrared Camera (NIRCam), which detects light from 0.6 to 5 microns, and the Mid-Infrared Instrument (MIRI), which captures thermal emissions stretching out to 28 microns. In contrast, the human eye and standard digital cameras perceive the visible spectrum, which terminates at approximately 0.7 microns.
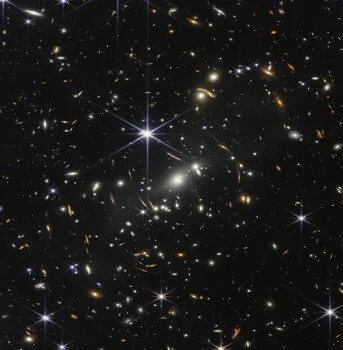
Because the universe is constantly expanding, light from the most ancient, distant galaxies is redshifted—stretched across space-time until its wavelength shifts from the ultraviolet and visible ranges into the infrared. Furthermore, infrared light possesses the unique physical property of being able to penetrate the dense, opaque clouds of interstellar dust that effectively "blind" optical telescopes like Hubble. By operating in the infrared, Webb functions as a cosmic X-ray, peering into the heart of stellar nurseries where new stars are born, shielded from our view by thick curtains of gas.
The Chronology of Data Acquisition
The process of creating a "Webb image" begins not with a shutter click, but with a series of monochromatic data captures. The telescope’s detectors record only brightness values—a single number per pixel representing the intensity of the light received. Each frame produced by NIRCam or MIRI is essentially a high-resolution grayscale image, capable of distinguishing between more than 65,000 shades of gray.
In the case of the Cosmic Cliffs, the scientific team utilized a variety of filters—29 for NIRCam and 9 for MIRI. These filters are high-precision glass elements that allow only specific, narrow slices of the infrared spectrum to pass through to the sensors. For example, the F090W filter captures light at 0.9 microns, while the F470N filter is tuned specifically to detect the glow of molecular hydrogen.
Once these individual grayscale frames are collected, the visualization team at the Space Telescope Science Institute (STScI) begins the "colorization" process. This follows a practice known as chromatic ordering. In this system, the shortest recorded infrared wavelengths are mapped to the shortest visible color (blue), while the longest infrared wavelengths are mapped to the longest visible color (red). Intermediate wavelengths are assigned to the green, yellow, and orange portions of the spectrum. This is not merely an aesthetic choice; it is a logical system designed to maintain the physical relationship between the different data layers, ensuring that scientists can interpret the resulting image with the same accuracy as a raw data chart.
Fact-Based Analysis of Visual Translation
Critics occasionally label these images as "false color" or "fake," a term that professionals in the field reject as a misunderstanding of scientific methodology. When NASA releases a Webb image, it is a faithful portrait of measured structure. Every filament, ridge, cavity, and star is positioned exactly where the telescope recorded it.
The "reality" of the image lies in the relationship between wavelengths. Even when colors are assigned, the relative positions of the light sources remain intact. In the Cosmic Cliffs, the orange, cloudy regions represent dust and gas captured in longer infrared channels, while the dark, blue-black areas indicate regions of lower density or shorter-wavelength emissions. The intensity of every pixel is a hard measurement, though the final display undergoes a "stretch" process—a mathematical function that enhances the contrast of faint features while preventing bright stars from overwhelming the detail in the nebular gas.
Official Perspectives and Expert Methodology
The visualization team, including specialists like Alyssa Pagan and Joe DePasquale, maintains that their work is a bridge between complex photometry and human perception. In their view, the images are representational, much like an MRI or a weather map. An MRI of a human brain does not show the actual colors of the tissues; it assigns colors to different densities of biological matter so that doctors can identify tumors or healthy tissue at a glance. Webb’s imagery performs an identical service for astrophysicists.
"We generally do some standard chromatic ordering because it has the most scientific value and meaning," explains Alyssa Pagan. However, the team admits that flexibility is sometimes necessary. When a specific narrowband filter reveals a critical scientific feature—such as the presence of molecular hydrogen—the team may choose to assign a contrasting color to that data layer to ensure the feature "pops" from the background. This is an aesthetic decision layered over scientific data, intended to maximize the interpretability of the photograph.
Joe DePasquale has noted that when filters have overlapping wavelengths, assigning them the same color would result in a muddy, illegible image. By strategically choosing distinct, logical colors, the team preserves the structural detail that would otherwise be lost in a monochromatic output.
Broader Implications for Space Exploration
The implications of this technology are profound. By translating the infrared into a format the human brain can process, NASA is enabling a new era of public engagement with astronomy. The images of the Pillars of Creation or the Southern Ring Nebula are not just "pretty pictures"; they are primary research tools. By viewing these composites, researchers can identify the formation of protostars within dusty disks, observe the chemical composition of dying stars, and map the large-scale structure of the early universe.
The "reality" of a Webb image is a testament to the sophistication of modern instrumentation. It is a portrait of a sky no human eye will ever see directly, constructed from the most accurate measurements ever taken of the cosmos. The colors act as a map legend, allowing the viewer to decode the territory.
As the JWST continues its mission, the public should view these colorized composites not as artistic distortions, but as the only honest way to represent the reality of a universe that is fundamentally hidden from our biological sight. The data remains the core of the experience—the colors are simply the language used to communicate that data to a species that was never meant to see the infrared sky, but has built the tools to do so anyway. Through this collaborative process of data acquisition and visual translation, humanity has effectively extended its vision to the very edges of the observable universe, turning the invisible glow of ancient dust into a vibrant, understandable, and deeply compelling map of our origins.